TVL Is a Mirage: How Ghost Liquidity Leaves Retail Traders Holding the Bag
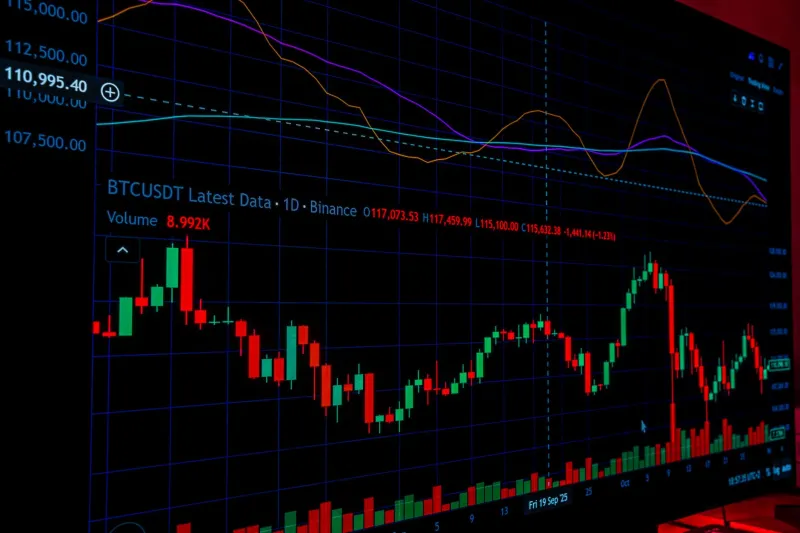
When a decentralized exchange reports $400 million in total value locked, the instinct is to treat that figure as a proxy for reliability. Deep pools, smooth execution, minimal slippage — the logic seems sound. It is not. At DeFi Scanners, our real-time protocol monitoring routinely surfaces a more uncomfortable reality: a substantial portion of the liquidity those numbers represent is functionally inaccessible when it matters most.
We call it phantom liquidity. And for retail traders in the United States navigating an increasingly complex DeFi landscape, it represents one of the more quietly dangerous misunderstandings in the space.
How Incentive Farming Inflates the Headline Number
The mechanism behind phantom liquidity is not a conspiracy — it is an emergent consequence of how liquidity mining programs are designed. Protocols compete aggressively for capital by offering token rewards to liquidity providers. Those providers, often sophisticated actors running automated strategies, deposit assets to capture yield. TVL climbs. Marketing decks look impressive. But the capital is not committed to the protocol — it is committed to the incentive.
When reward rates drop, or a competing farm offers superior APY, that capital migrates. It can exit within a single block. What remains is a snapshot metric that tells you where liquidity was, not where it is or will be when your trade hits the mempool.
Our scanner data from a 90-day monitoring window across 14 mid-tier AMMs showed that protocols running active liquidity mining campaigns exhibited an average of 34% higher TVL volatility compared to protocols relying on organic, fee-driven liquidity. During periods of broader market stress, that gap widened further — precisely the conditions under which traders most urgently need deep, stable pools.
The Reported vs. Actionable Liquidity Gap
There is a meaningful distinction between reported liquidity and actionable liquidity. Reported liquidity is the aggregate of all assets deposited in a protocol's smart contracts. Actionable liquidity is the subset of that capital which can absorb a trade of a given size without producing unacceptable slippage.
Consider a concentrated liquidity protocol where a large portion of deposited capital is positioned well outside the current trading range. That capital appears in the TVL figure. It does not appear in the effective order book. A trader executing a $50,000 swap may be drawing from a pool that looks like $80 million on paper but behaves like $12 million in practice.
To quantify this, DeFi Scanners tracks what we term the Liquidity Utilization Ratio — the proportion of reported TVL that sits within a statistically relevant price band around the current spot price. Across the protocols we monitor, this ratio averages significantly below what headline TVL implies, with some protocols showing as little as 18 cents of actionable liquidity for every dollar reported.
Slippage Shocks in Real Conditions
The consequences of this gap are not theoretical. During periods of elevated volatility — think a sudden 8% market correction in a major asset — concentrated liquidity positions frequently rebalance or exit entirely. Retail traders executing swaps in the minutes following a price shock often encounter slippage multiples of what the pre-trade estimate projected.
This is not a failure of the AMM mechanism per se. It is a failure of the information environment. A trader checking a protocol's TVL dashboard before a swap is not receiving the data they actually need. They are receiving a marketing metric.
Our monitoring infrastructure flags protocols where real-time liquidity depth has diverged significantly from recent TVL averages — a signal we have found precedes elevated slippage events with meaningful consistency. In several documented cases, this divergence appeared 48 to 72 hours before a high-slippage episode affected retail participants.
Reading Genuine Market Depth
So how does a retail trader distinguish authentic liquidity from the ghost variety? Several on-chain indicators are more reliable than TVL alone.
Liquidity provider tenure is among the most informative. Pools where the median LP has been deposited for 30 or more days exhibit considerably more stability than pools dominated by recent entrants chasing a new incentive program. On-chain data makes this visible.
Fee revenue relative to TVL is another signal worth examining. A protocol generating substantial swap fees relative to its reported TVL is attracting traders — which means its liquidity is being used, tested, and presumably priced accurately by the market. A protocol with high TVL and low fee revenue is likely a yield farming destination, not a trading venue.
Token emission schedules deserve attention as well. When a protocol's native reward token emission rate is scheduled to drop significantly in the coming weeks, the liquidity mining incentive weakens. Capital will begin positioning to exit before that reduction hits. Monitoring emission schedules gives traders a forward-looking view of liquidity risk that TVL snapshots simply cannot provide.
What Our Scanners Are Watching
At DeFi Scanners, phantom liquidity detection is an active component of our protocol intelligence layer. We cross-reference reported TVL against in-range liquidity depth, LP wallet age distributions, and emission schedule timelines to generate a composite liquidity quality score for monitored protocols.
The goal is not to discourage participation in liquidity mining ecosystems — those programs serve legitimate purposes and have driven genuine protocol adoption. The goal is to ensure that when a trader evaluates a protocol, they are working from accurate intelligence rather than a headline number engineered to attract attention.
TVL will likely remain the dominant DeFi marketing metric for the foreseeable future. It is clean, simple, and impressive when large. But for anyone making real capital allocation decisions, it is a starting point at best and a trap at worst. The depth that matters is the depth that executes — and that requires looking considerably further than the dashboard.